
Bootstraping as a technique for building confidence intervals
#statistic #statistics #statistical
20210114223129
When you want to extract a value from a series of data (like a mean, a prediction from multiple weak classifiers - RandomForests - etc.. ) you may also need to know a confidence interval for that number.
One analytical way of doing this is by employing a technique called Bootstrapping. This is a good whiteboard explanation for it.
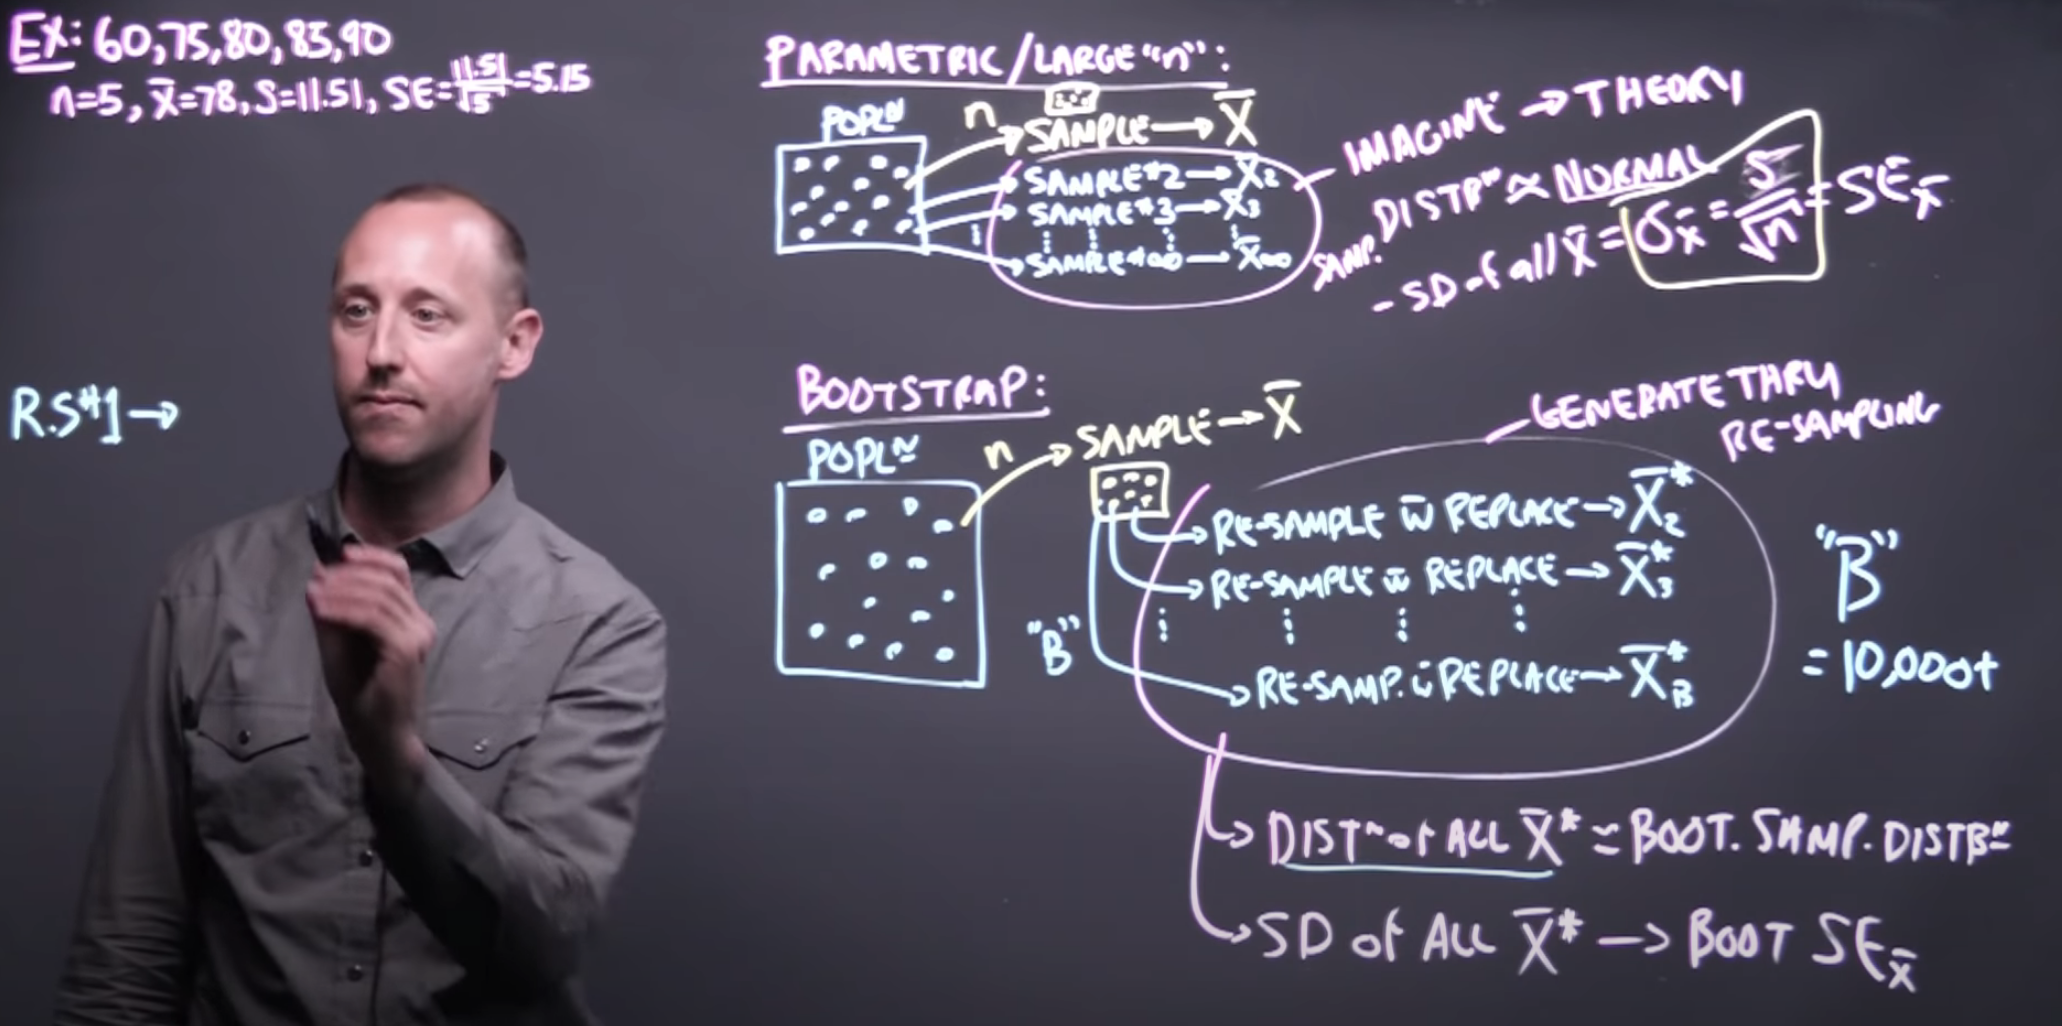
The procedure is roughly the following:
- do multiple times (at least 10 000) the following:
- resample with replacement a number of \(n\) elements from the original dataset (presumed to be of size \(n\) as well)
- on the resulted series compute your desired metric
- at the end of the above loop you should have a series of metrics computed on a list of synthetic (resampled) data akin to multiple Monte-Carlo simulations.
- On the above series of metrics, compute the histogram as it should resemble a normal distribution (bell shaped) - by the Law Of Large Numbers.
- Compute the parameters of this normal distribution, the mean and the std to see
- where your confidence interval starts and end ( [-2std, +2std] encompass 96.7% observations, [-3std, 3std] encompass 99.7% observations, etc..)
Find also here a refresher on confidence intervals computed directly on the std of a normal class
This video from Khan academy is also great at explaining p-value calculation
See also:
- https://www.khanacademy.org/math/statistics-probability/confidence-intervals-one-sample
Backlinks
- Statistics course on Khan academy
- [[20210114223129]] Boostraping for confidence intervals
Backlinks last generated 2022-01-08 20:08:39


Comments