
Building an ai mechanical nose
Working with cool projects
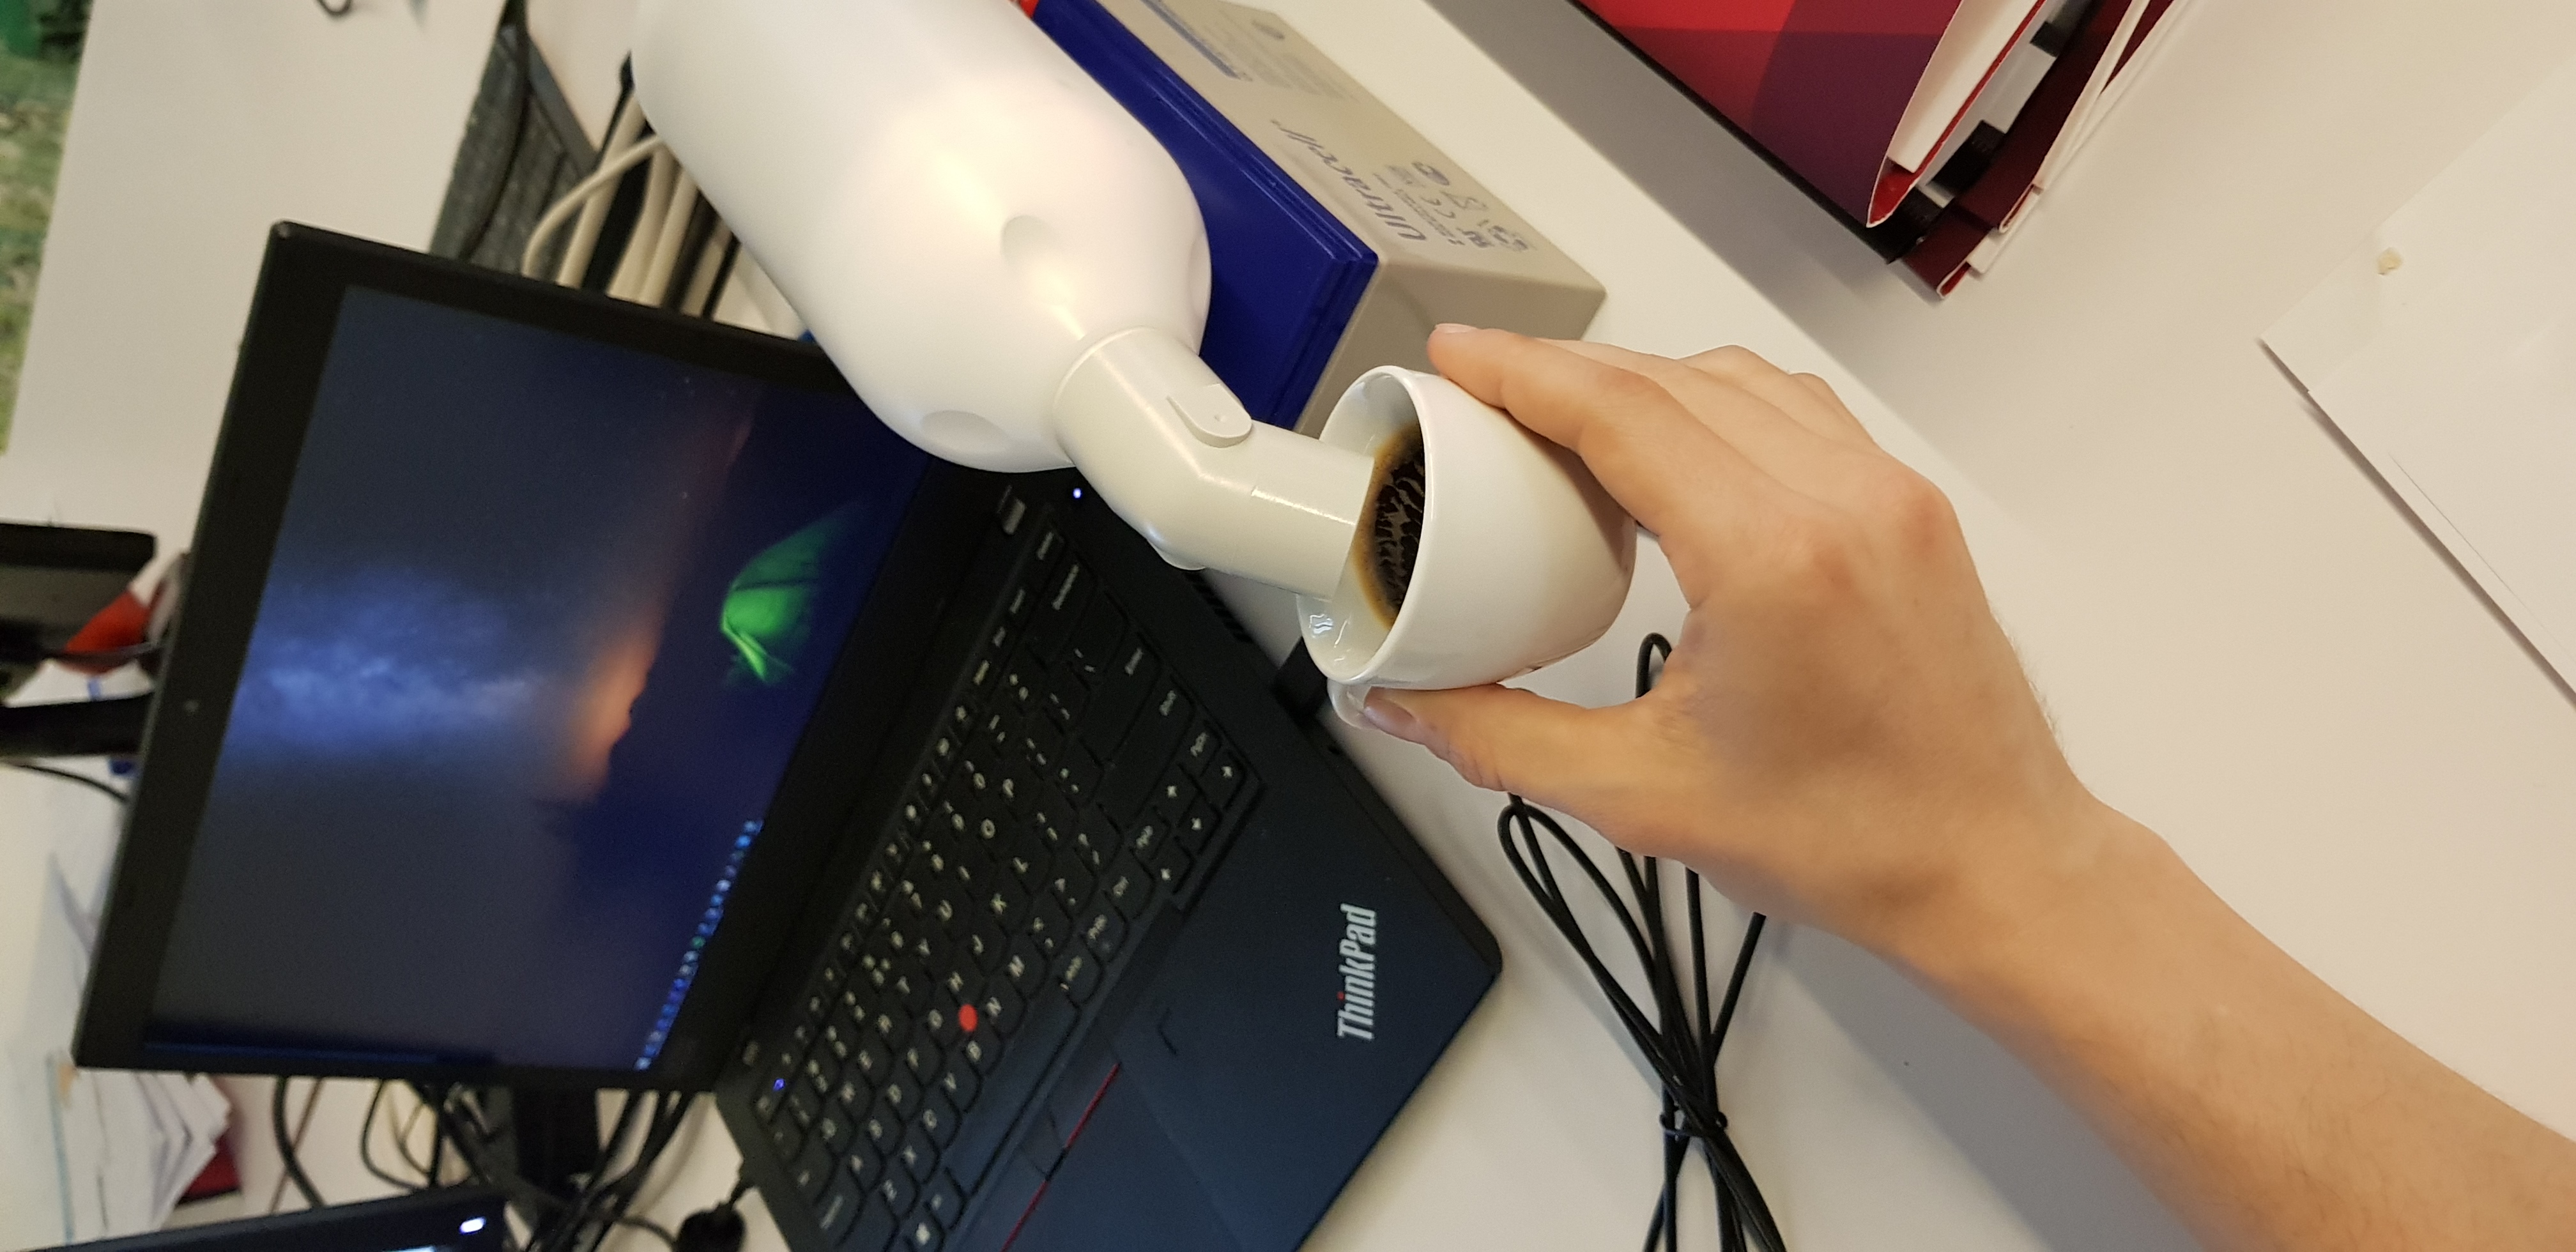
One of the companies that I collaborate with (i.e. Tecknoworks) deals with a lot of interesting projects, but besides the projects themselves, there’s also a nice mix off cool pieces of equipment. One example of such equipment is the Breathomix eNose device.
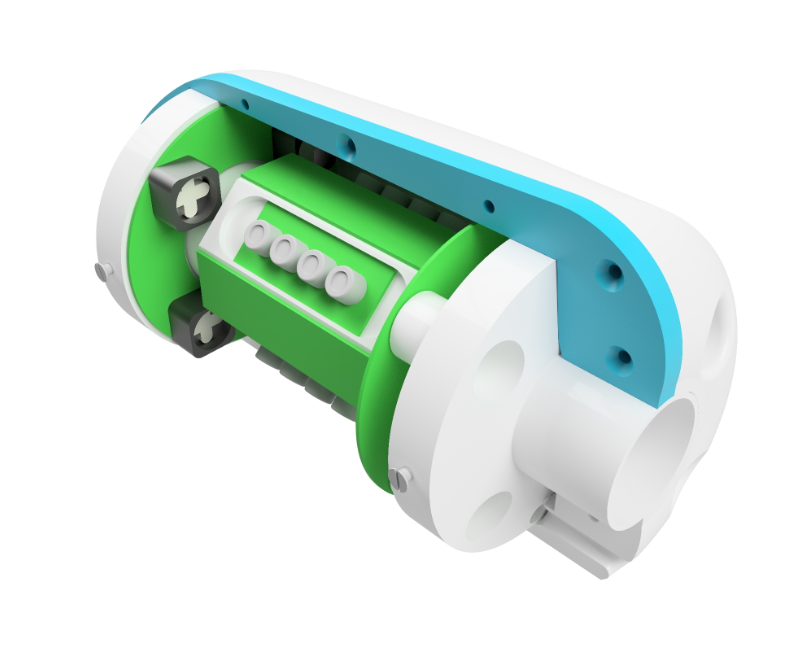
This device analyzes the mixture of molecules in exhaled breath in real-time based on advanced signal processing and an extensive online reference database, infused with AI.
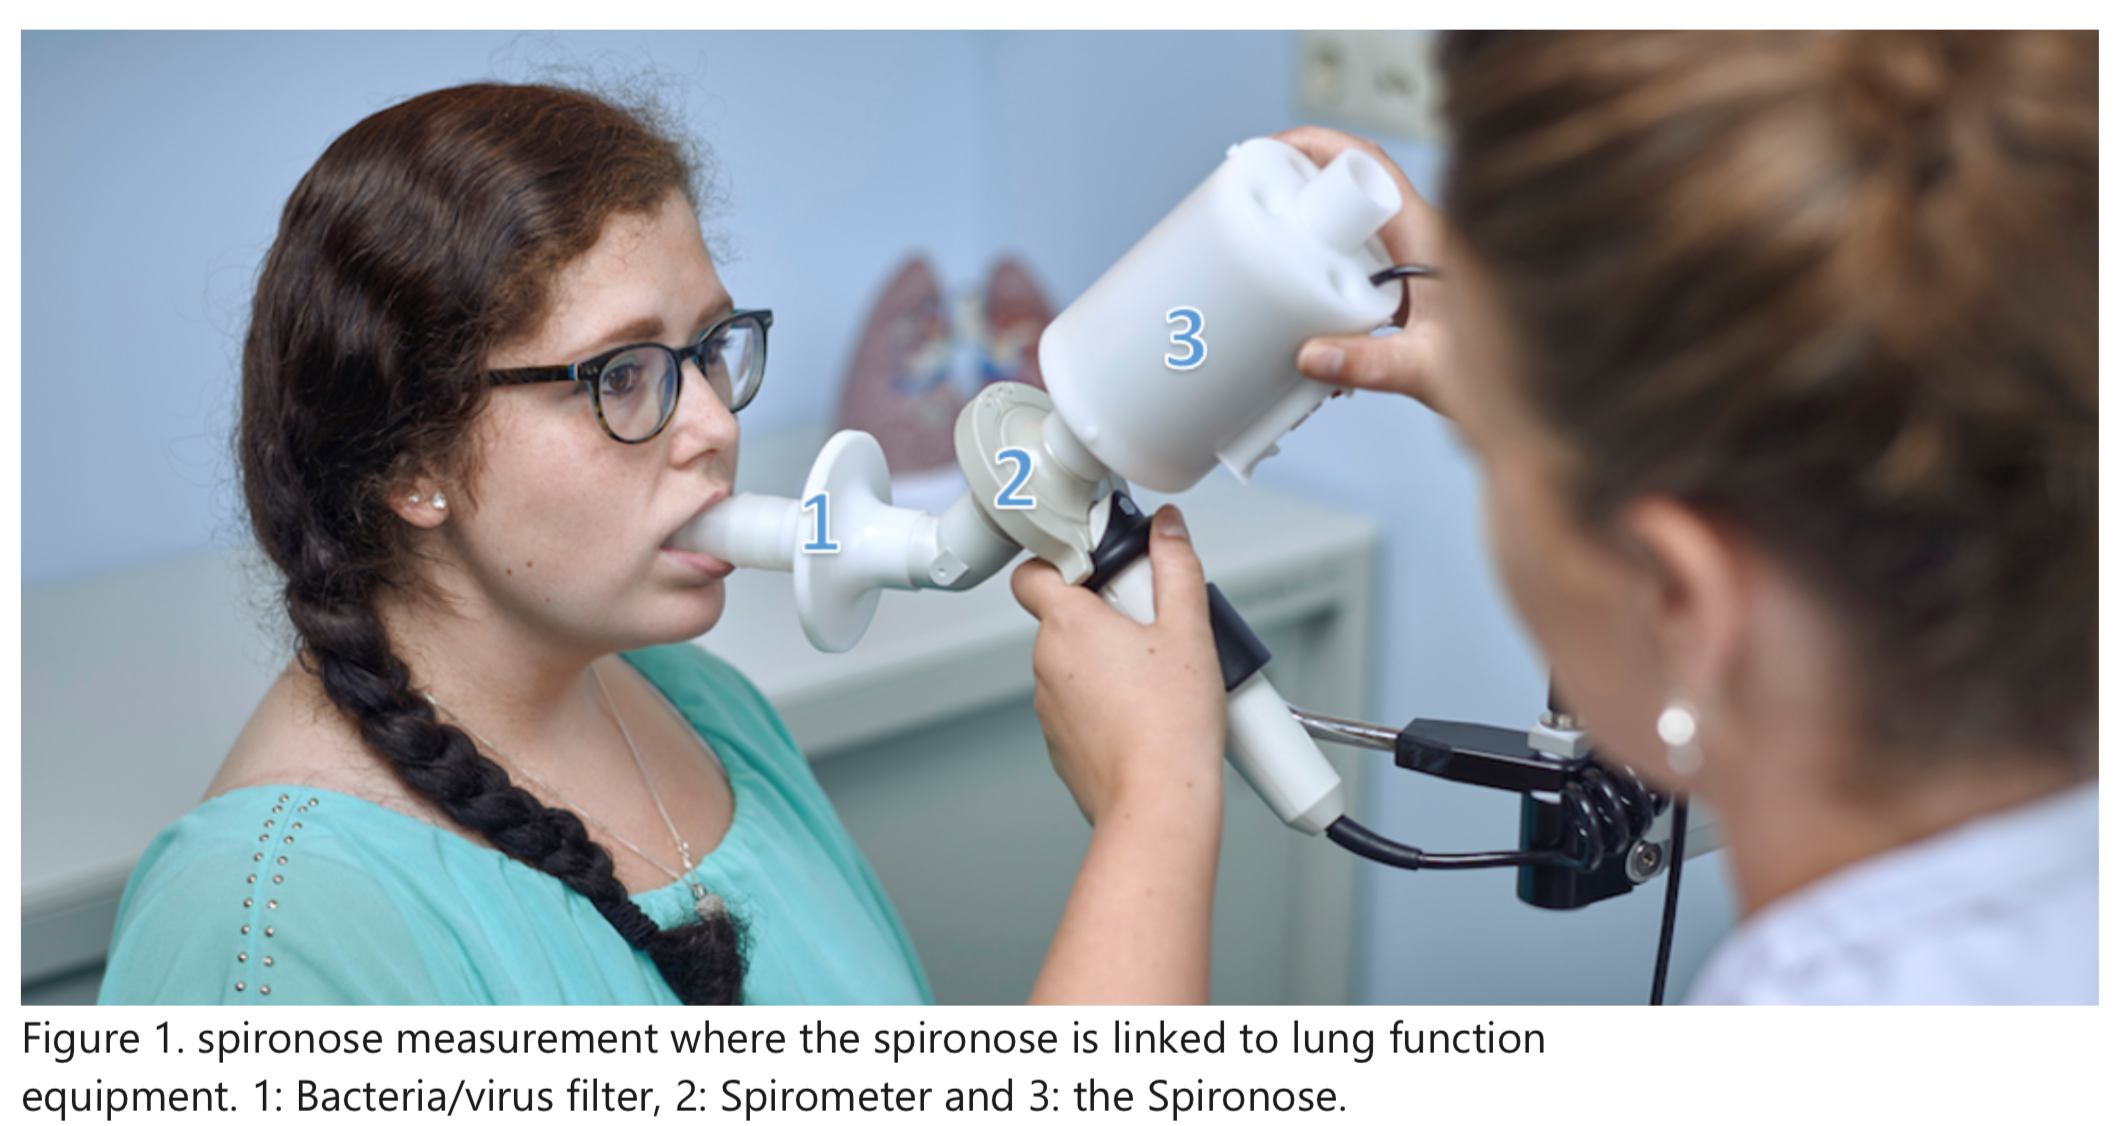
The eNose is a technical and clinical validated integration between routine spirometry and electronic nose (eNose) technology connected in series with each other, allowing diagnosis and stratification of patients with cancer, infectious and inflammatory disease in the doctor’s office.
The device itself is quite interesting to interact with but since it’s main purpose was to be used in medical diagnosis of various pulmonary diseases, you can’t do much with it, except for breathing into it.
..or can you?
Repurposing the nose
The eNose device has multiple sensors that can detect various types of chemicals (or volatile compounds). It also includes sensors for temperature, pressure and humidity and so we thought:
Since most real-life objects interact with these sensors in their own distinct way, is it possible that we can use the eNose to detect various classes of objects?
To be more specific, can we distinguish between these objects:
- tea
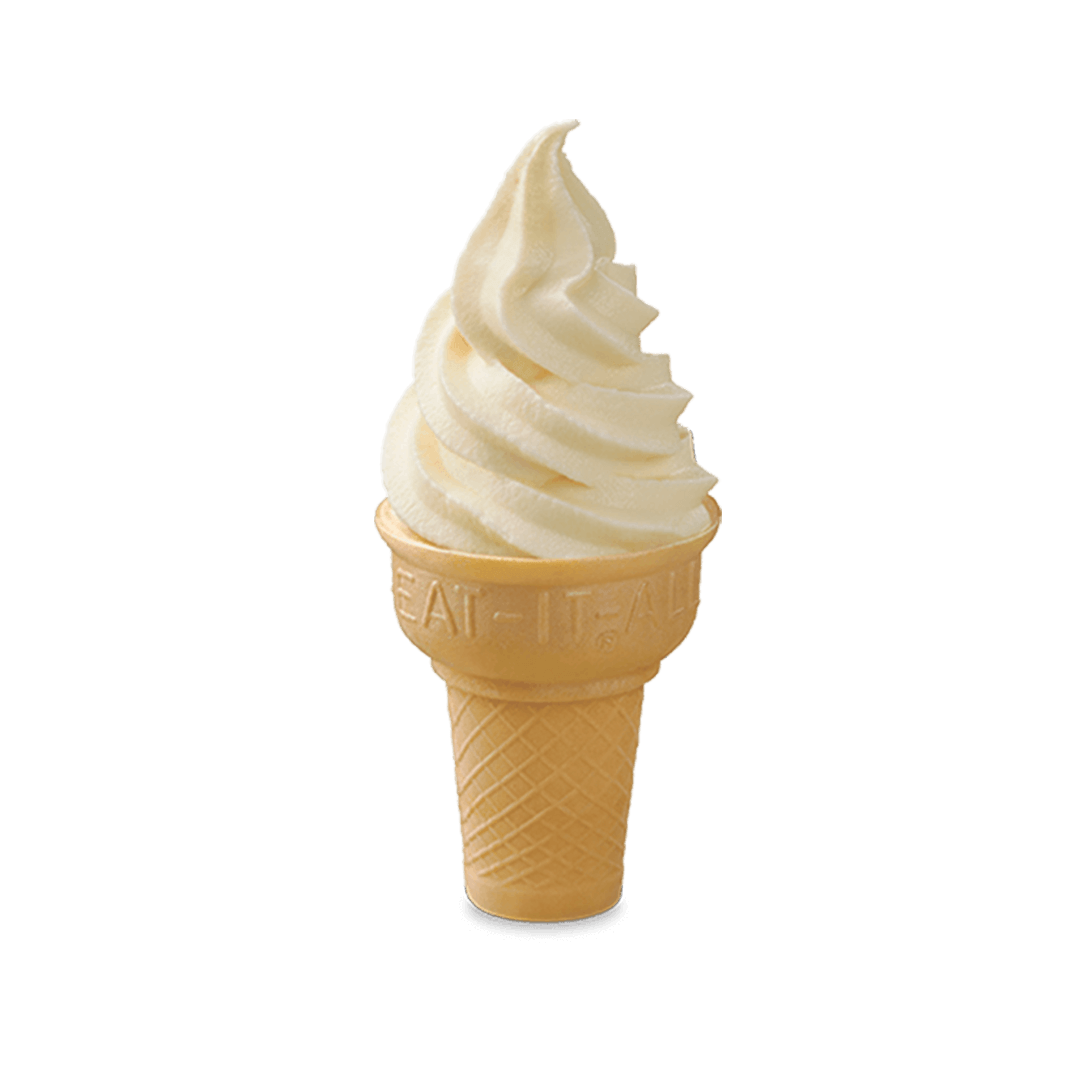
- ice-cream
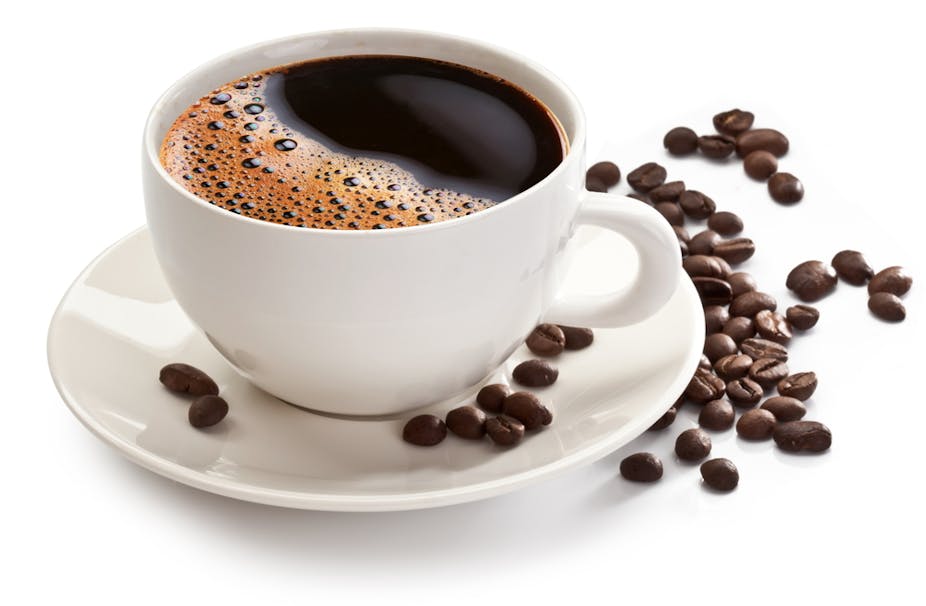
- coffee

Validating assumptions before the experiment
Before we started digging more into this project we needed to validate two key assumption:
- Does coffee, tea and ice cream emit VOCs?
- Can the
eNosedetect these compounds?
Volatile organic compounds
It turns out, that for the first question, the answer is yes. Most scents or odors are of VOCs (wikipedia except, bellow).
Volatile organic compounds (VOCs) are organic chemicals that have a high vapor pressure at ordinary room temperature. Their high vapor pressure results from a low boiling point, which causes large numbers of molecules to evaporate or sublimate from the liquid or solid form of the compound and enter the surrounding air, a trait known as volatility.
There are a few papers [1, 2, 3] documenting the VOCs emanated by coffee.
[1] From the green bean to the cup of coffee: investigating coffee roasting by on-line monitoring of volatiles, pdf
[2] Volatile Organic Compounds in Brewed Kenyan Arabica Coffee Genotypes by Solid Phase Extraction Gas Chromatography Mass Spectrometry, pdf
[3] CHAPTER 33. Coffee Volatile and Aroma Compounds – From the Green Bean to the Cup: Production, Quality and Chemistry, pdf
You can even find this cool infographic that digest these for you

Much of the same can be said about tea and ice cream [4, 5]. Both have strong odors and specifically for ice cream, it being a mixture of different substances, there are lots of VOCs that it releases into the air.
[4] Volatile and non-volatile compounds in green tea affected in harvesting time and their correlation to consumer preference pdf
[5] Recent studies of the volatile compounds in tea pdf
Can we detect them with the device?
Although I can’t really share details about the internals of the device, the internal specs confirm that we can capture some of the VOCs released.
It only remains to be seen if we have enough of a reliable signal to finderprint them and build a sufficienly accurate classifier on the data the eNose is able to capture.
Data gathering
As goes with all machine learning projects, collecting the (correct) data is maybe the hardest part. We set out to collect ours by making multiple measurements of the three categories.
Truth be told, we set out first to distinguish between only tea and ice cream but while implementing the system we found out that the two were too easily separable. This happened because one ouf our sensors was measuring the temperature, and you know… ice cream is cold and tea is hot :)
Methodology
We’ve collected 100 measurements for each of the three categories trying our best to account for possible variations:
- we’ve used 4 different kinds of tea
- we’ve used 4 different recipies of coffee
- Espresso
- Coffee with milk
- Americano
- Cappucino
- we’ve varied the temperature of both tea and coffee (ranging from
hottoroom temperature)
In addition to the three categroies above we’ve added a forth one, which was a calibration reading the purpose of which we will describe bellow.
What a measurement looks like..
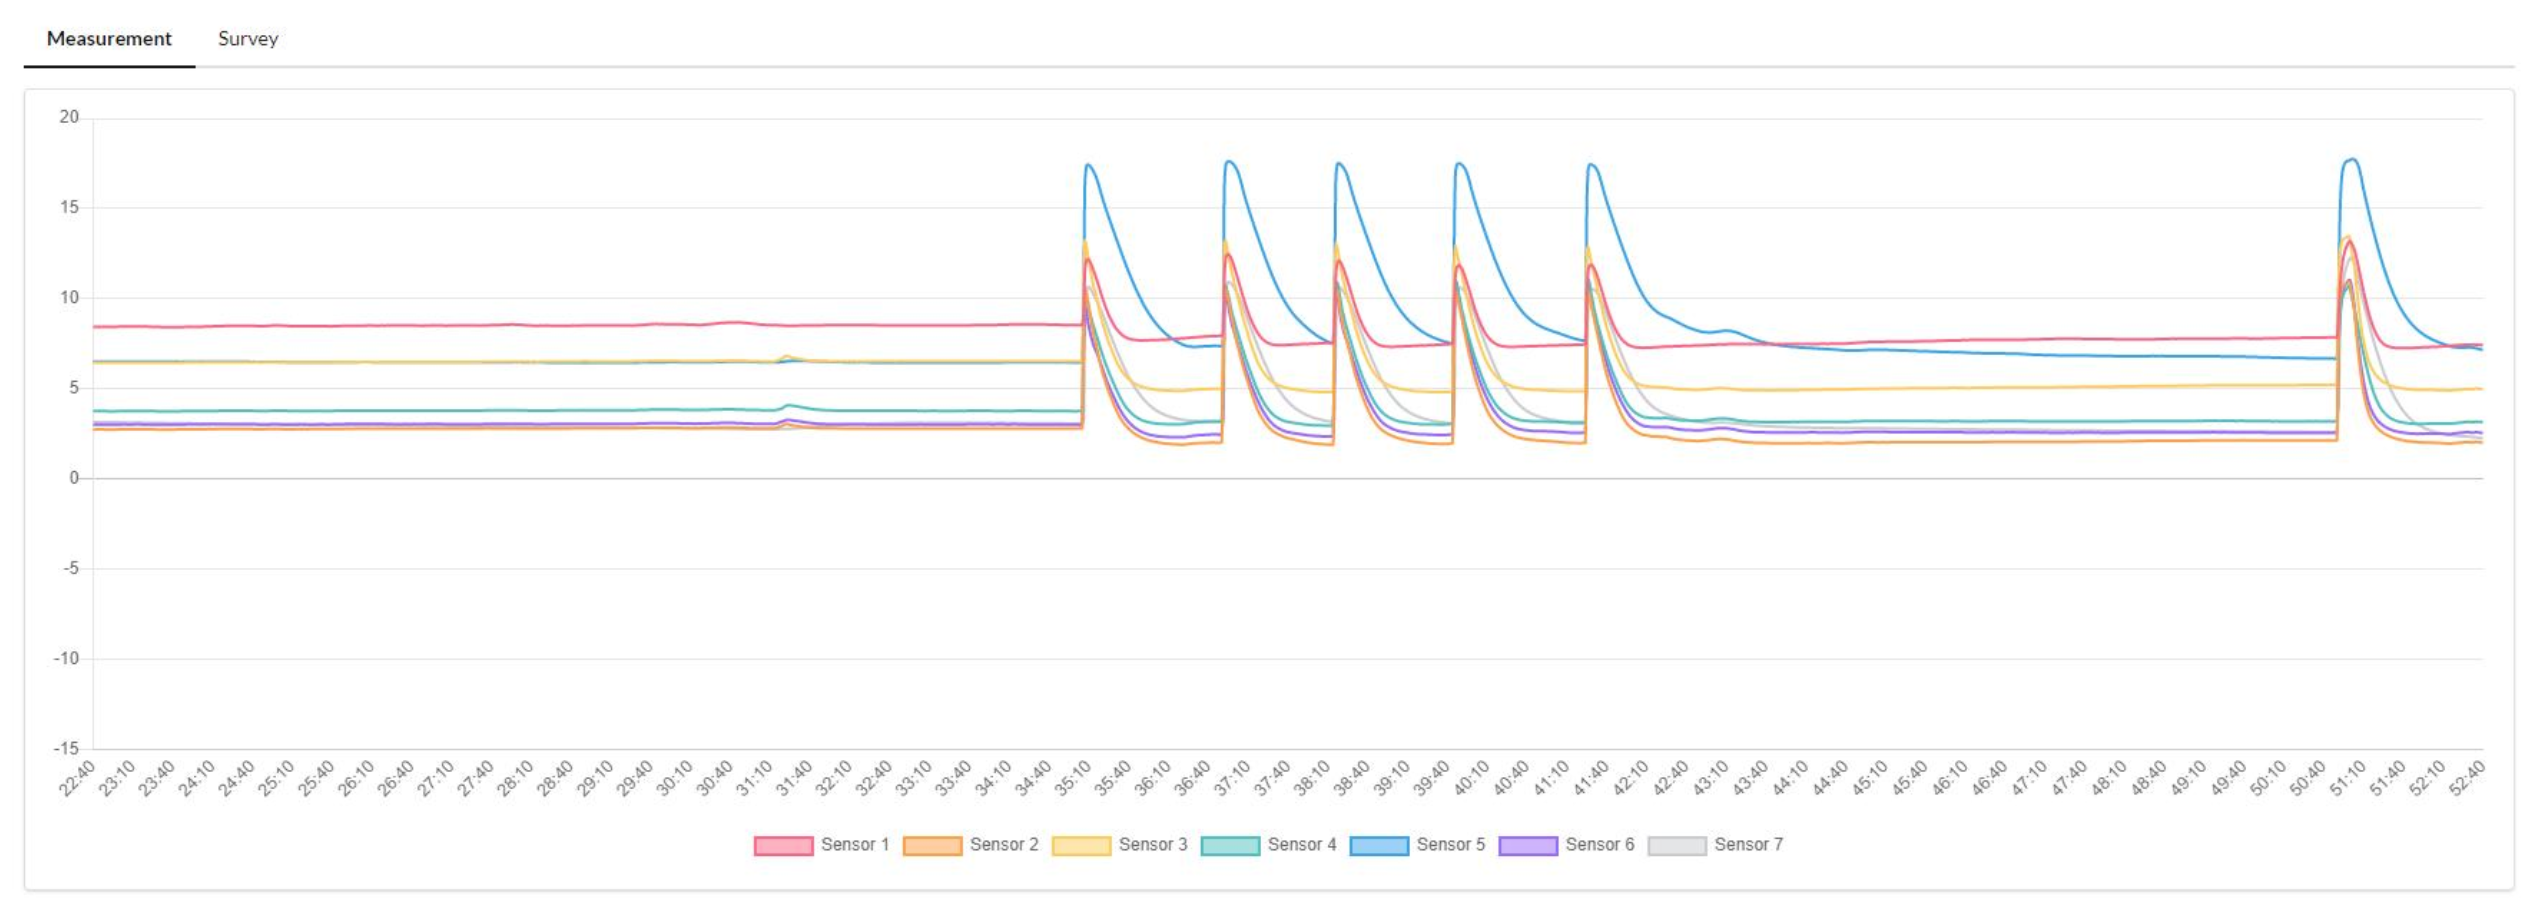
In the figure above you can see how the system reacts when someone breathese multiple times into it. While the peaks are quite clear in their meaning, the tail end of each spike is a period of decalibration where chemicals aren’t actually detected, but the sensors, being saturated, still send detection signals untile they level off.
Think of this transition as what happens to a temperature sensor going from hot to cold. There is a period of inbetween-ness that exists.
Although you can visually see that signals are leveling off to a minimum, because each sensor has it’s own velocity in doing that, it’s quite hard to program a computer (except for using machine learning) to known when there is nothing to predict (i.e when the subject of you measurement - the coffee - isn’t present under the sensors anymore).
Another thing that is equally important is knowing what are the baseline measurements for a specific sensor so we can make the algo learn to distinguish beween noise and signal.
For all of the above resons, we’ve collected data on the calibration category, a state which may happen:
- between 10 seconds after the readout of a substance and up to 1 minute after that (the
desaturation) - after 3 minutes have past since the last measurement (the
idlestate)
In hindsight maybe it would have been better to actually split the two in their own category but I guess we’ll leave this to a future (maybe?) iteration.
Dataset
All in all we had 4 categories:
- tea
- ice cream
- coffee
- calibration
And for each one we’ve collected 100 samples for a total of 400 datapoints.
Modeling
Exploratory data analisys
After loading the data into pandas and a few not so sexy data massaging steps we’ve graphed the outputs of all the sensors from all the samples, using boxplots.
What we wanted to (literally) see was if it was obvious for a human, or at least possible, to distinguish between the three. I think this is a fair rule of thumb for quickly validating the feasability of any ML project (this doesn’t mean that anything a human can’t do quickly is equally hard to a machine, just the opposite - if a human can, ML could as well).
If you’d be presented with the charts bellow, would you conclude that the readings of the sensors in each case shows that the categories are separable?
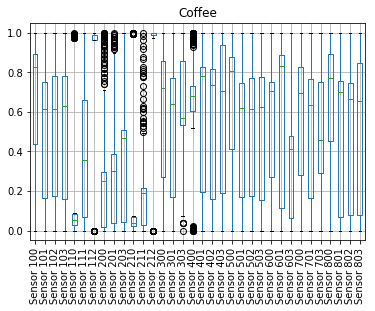
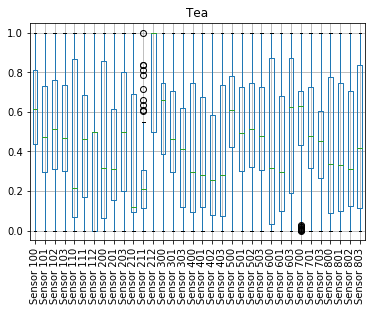
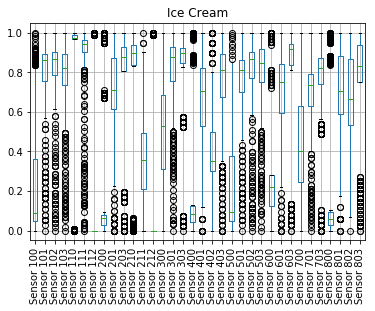
We think that (for anyone able to interpret a boxplot) is easy to see that there are sensors with distinct shapes, specific to only one category. The only question that we need to be able to solve now, with machine learning, is finding out what pattern of sensor readings is associated with each category.
Sensor deduplication
Another problem with our setup was that the eNose had multiple redundant sensors.
Of course we could have just read the specification on the device and only keep a single instance of each but:
- this device being a prototype (so assembled by hand, with some sensors possibily malfunctioning) and
- because sensors, having different placements, would make them more/less capable of detecting VOCs
we’ve gone with the data scientist’s way of deduplicating them.
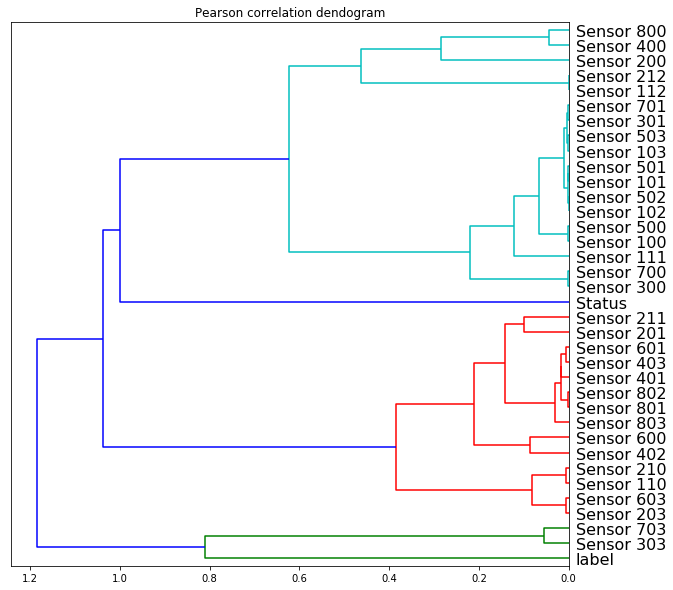
The main goal was to only keep the readings of the sensors that showed to be most promissing in terms of information gain. On this end, we’ve computed the perason correlation coefficient and put everything into a dendogram plot that you can see bellow.
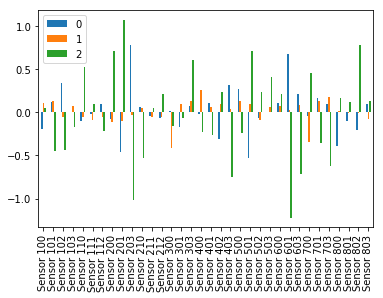
At the same time, we’ve trained a simple logistical regression model for inspecting the learned weight magnitudes (the results of which you can see bellow). The basic idea is that large weights (either positive or negative) are a proxy for important features that we want to keep.
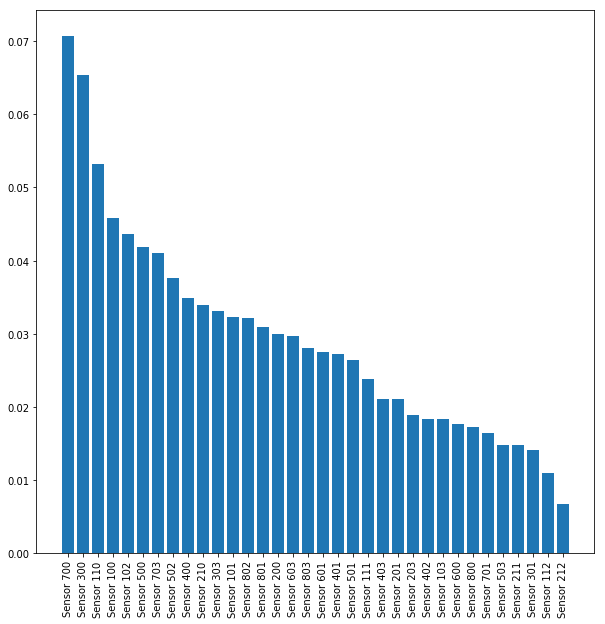
Since this wasn’t enough we’ve also computed a more scientifically valid feature importance plot by training a Random Forest.
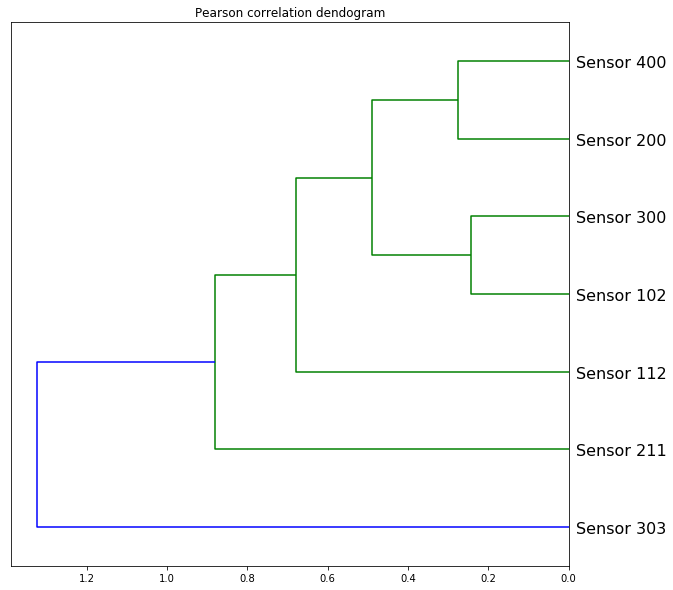
All in all, through a semi manual process that took all the above results into considetation we’ve selected only the reading of the following sensors bellow:
Model tunning
After figuring out that the problem may be solvable and what data we should use, the next step was to put everything to the test and train a machine learning algorithm to asses the system performance.
We didn’t use something too fancy, just a plain Random Forest that we later hyper-tunned using grid search where the best configuration found was:
{
 'criterion': 'gini',
 'max_depth': 10,
 'max_features': 'log2',
 'min_samples_leaf': 1,
 'n_estimators': 1000,
}
Results
The final accuracy that we’ve got revolved aroung the 87% figure. You can see bellow a full classification report.
precision    recall  f1-score   support

      coffee       1.00      0.99      0.99        35
   ice-cream       0.82      1.00      0.90        30
         tea       0.68      1.00      0.81        38
 calibration       1.00      0.74      0.85        29

   micro avg       0.87      0.87      0.87       132
   macro avg       0.87      0.93      0.89       132
weighted avg       0.90      0.87      0.87       132
Deployment
The final thing we did was to deploy this into “production”:
- serialize the notebook trained model into a pickle format.
- encapsulate the model into an Azure function
- write a quick web app that would do the measurements, and use the deployed model to predict on the outcome.
Conclusions
In the end we were able to build an end-to-end system for detecting coffee, ice-cream and tea with around 87% accuracy. It was a fun project that didn’t require more than a few days of work.
Having said that, we know this was rather a hack and could improve a lot in regards to the methodolody, modeling and analisys, should we iterate this. All this process is up to this point quite rudimentary. We haven’t spent much time on finding better classification algorithms, building a more robust pipeline and doing feature engineering.
Keep in mind this was just a quick, fun, prof-of-concept experiment, with 87% accuracy.
Post made in collaboration with **Florin Bobis**
Special thanks to **Tecknoworks and Breathomix** for allowing us to publish these results.
Comments